Industry
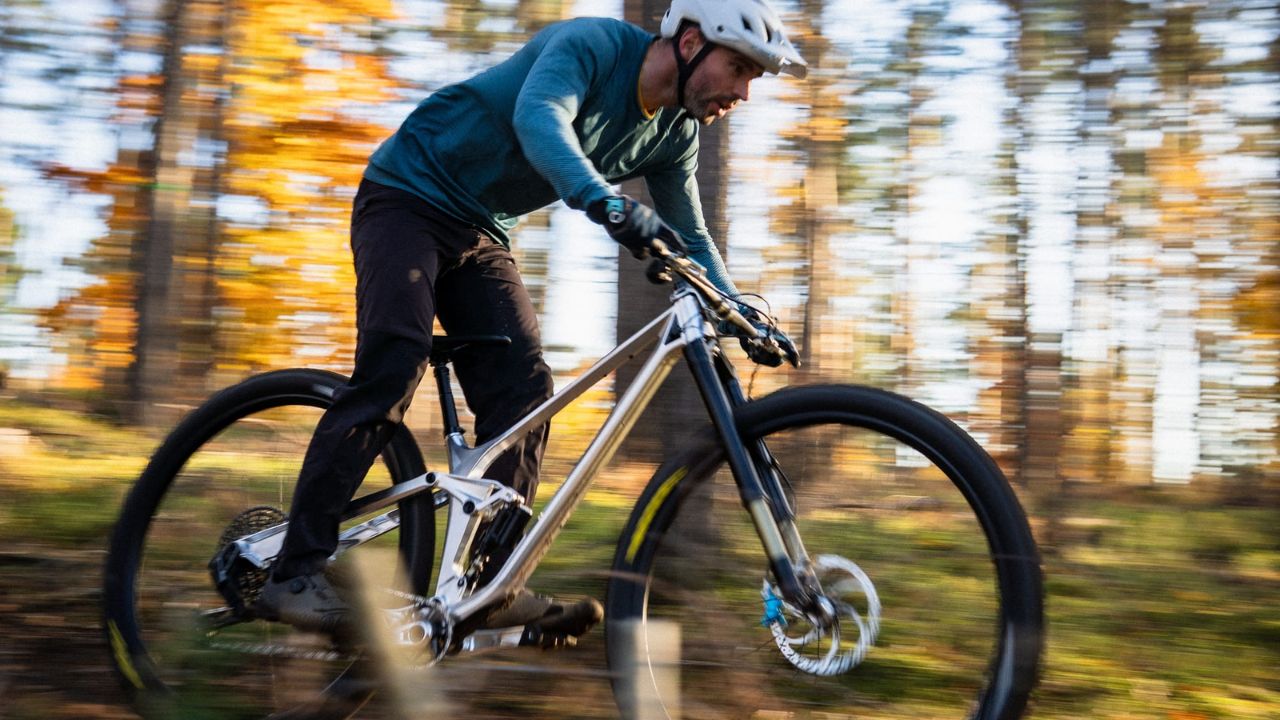
From Trail to Enduro: The Evolution of Full Suspension MTB Frame Platforms
February 4, 2026

Industry
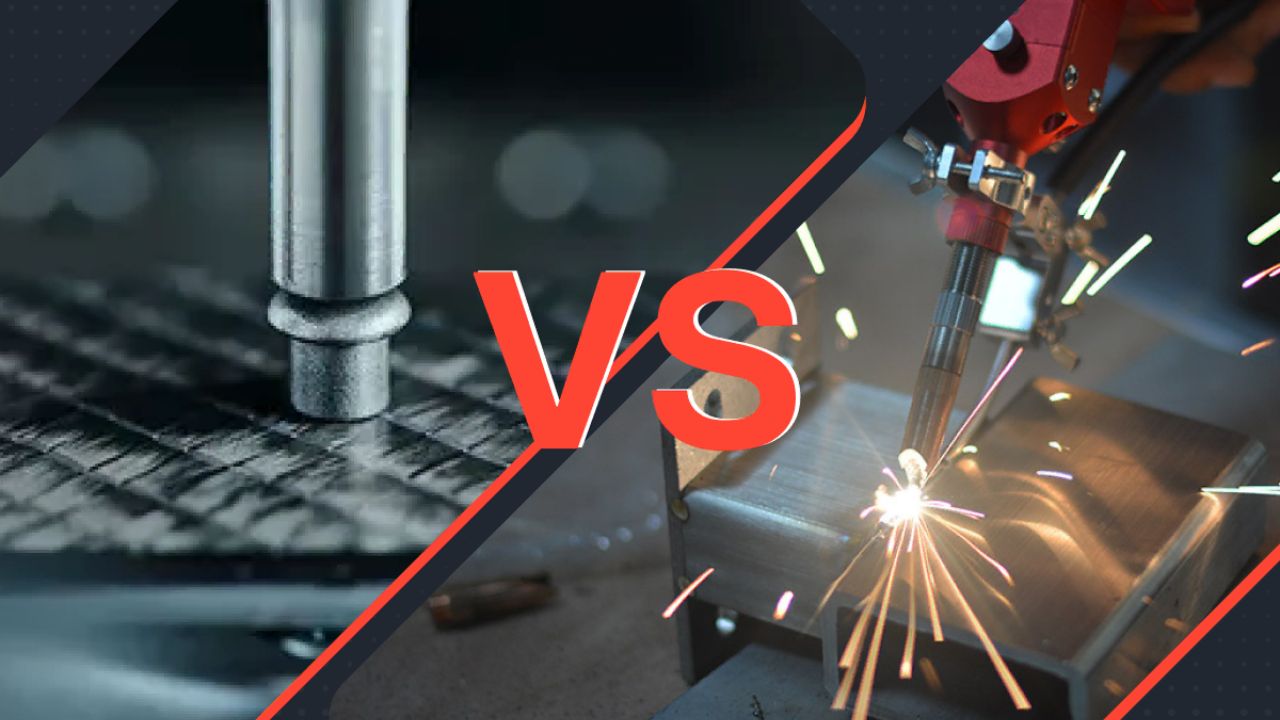
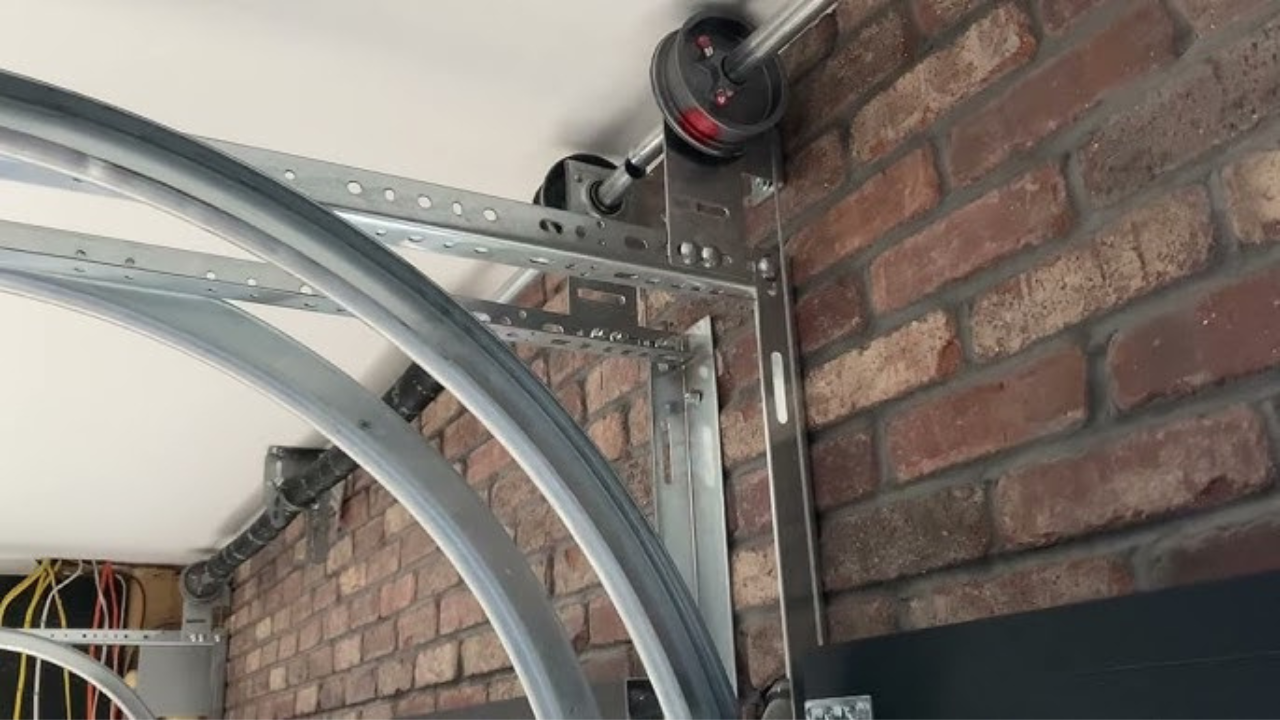
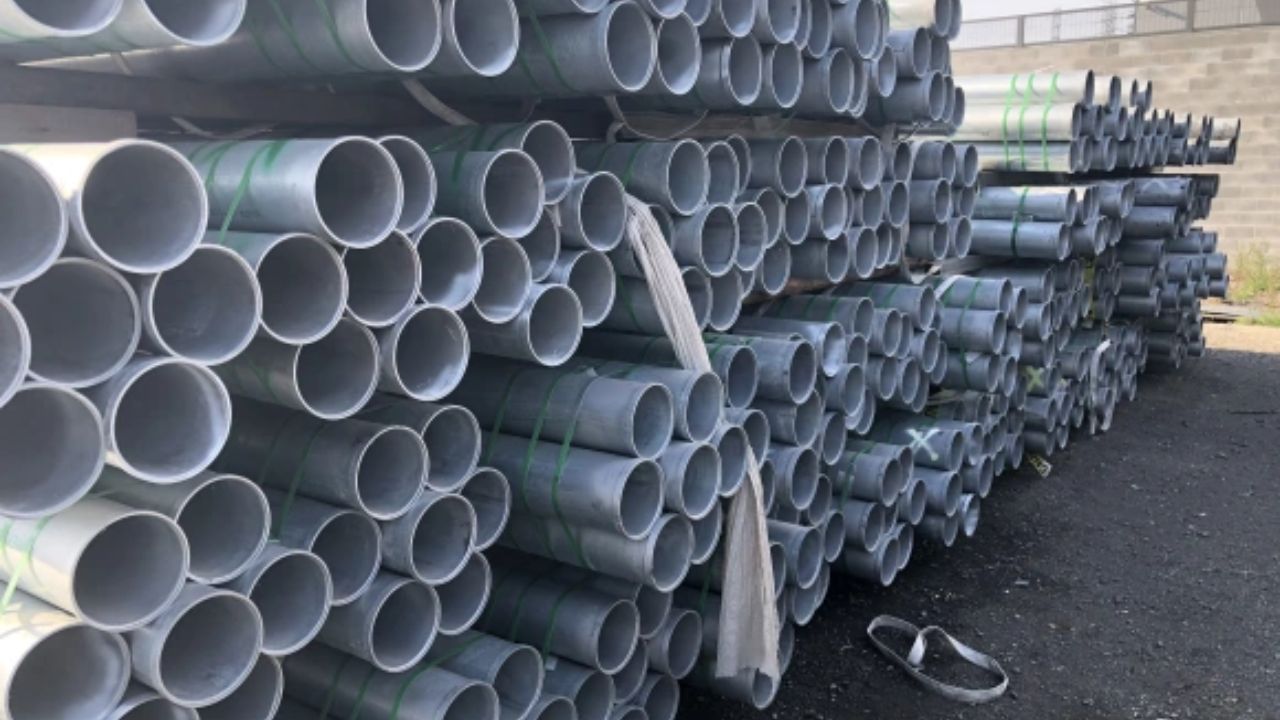
What Is the Influence of Garage Door Track Radius on the Performance of Doors
December 7, 2025
Business
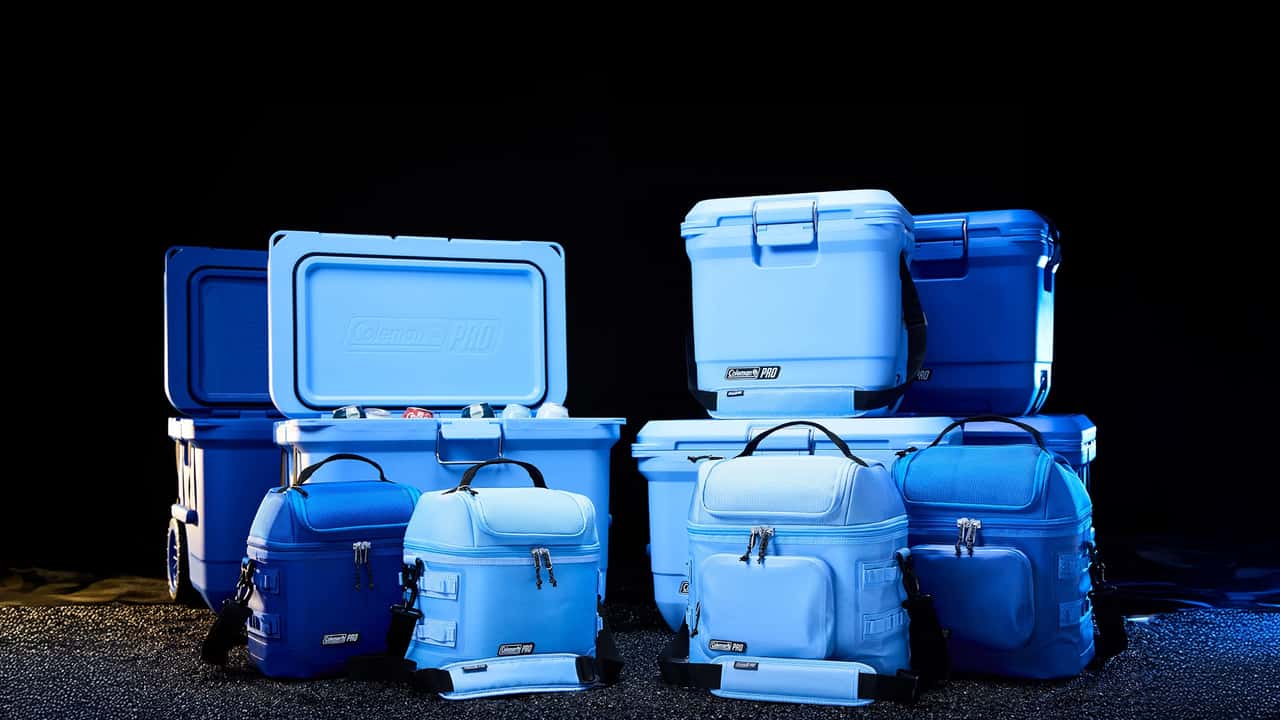
Everich Cooler Box Manufacturers: Eco-Friendly and High-Performance Solutions
October 22, 2025